
SQL & Tableau Project: the Coronavirus Pandemic
Note: This project displays the following SQL skills:
- Filtering data
- Joins
- Grouping and Aggregation
- CTEs
- Derived tables
- Subqueries
- Views
Introduction
This analysis concerns the Coronavirus pandemic and is conducted in SQL as part of my portfolio. It is aimed at extracting and visualising data related to Covid-related deaths, vaccination rates, mortality rates and more, broken down by country, continent and time.
In this way it aims to provide important information about the success (or lack of) of different countries in combatting the pandemic. It also aims to provide a picture of how the pandemic evolved over time.
This post contains only queries and a few visualisations. The tables that the queries return, and therefore the interpretation of the tables, are not inserted or discussed. This is due to the large size of the resulting tables.
I have structured the document so that queries start simple and are country-level and progress in complexity while zooming out to global-level analysis.
A short summary of this project, including information on the data tables, columns, data types and data source can be found in a GitHub repository README file.
There is also a dashboard visualising some of the queries that are present below. But all of the visualisations in the dashboard can also be found below, attached to the relevant query.
Part 1 - Data Cleaning
Here I’m going to
- add primary keys
- change the data types of certain columns to better reflect the inherent type of data they contain
- change the date format to reflect the standard date format for SQL (yyyy-mm-dd)
- replace missing values consisting of empty strings with 0
-- add primary keys

alter table
    deaths
add
    id int not null auto_increment primary key first

alter tablE
    vaccinations
add
    id int not null auto_increment primary key first

-- format 'date' column to correct format (yyyy-mm-dd) for both tables

update
    deaths
set
    date = date_format(str_to_date(date,'%d/%m/%Y'),'%Y-%m-%d')
update
    vaccinations
set
    date = date_format(str_to_date(date,'%d/%m/%Y'),'%Y-%m-%d')

-- replace empty values in column 'total_deaths' in 'deaths' table with 0, then change data type to int

update
    deaths
set
    total_deaths = 0
where
    total_deaths = ''

alter table
    deaths
modify
    total_deaths int

-- do the same as above for column 'new_deaths' in 'death' table

update
    deaths
set
    new_deaths = 0
where
    new_deaths = ''

alter
    table deaths
modify
    new_deaths int

-- replace empty values for column 'continent' in 'death' table with NULL

update
    deaths
set
    continent = null
where
    continent = ''

-- replace empty values in continent in 'new_vaccinations' table with 0
-- then change its data type to 'bigint'

update
    vaccinations
set
    new_vaccinations = 0
where
    new_vaccinations = ''

alter
    table vaccinations
modify
    new_vaccinations bigint

-- replace missing values with 0 for 'people_vaccinated' and 'people_fully_vaccinated' in 'vaccinations' table

update
    vaccinations
set
    people_vaccinated = 0
where
    people_vaccinated = ''

update
    vaccinations
set
    people_fully_vaccinated = 0
where
    people_fully_vaccinated = ''


-- find the data which was not uploaded in 'deaths' table. This must be done because MySQL Workbench does not fully import the 'deaths' table

select
    a.location
from
    vaccinations a
left join
    deaths b on a.id = b.id
where
    b.id is null
group by
    a.location

-- Data was not uploaded for every country from Urguguay (inclusive) onwards ordered
-- alphabetically, until Zimbabwe (inclusive)
Part 2 - Country-level Questions
I’m going to select a single country to narrow down the frame of the analysis. This will be Germany. Later I will expand briefly to continent-level analysis and finally global-level analysis.
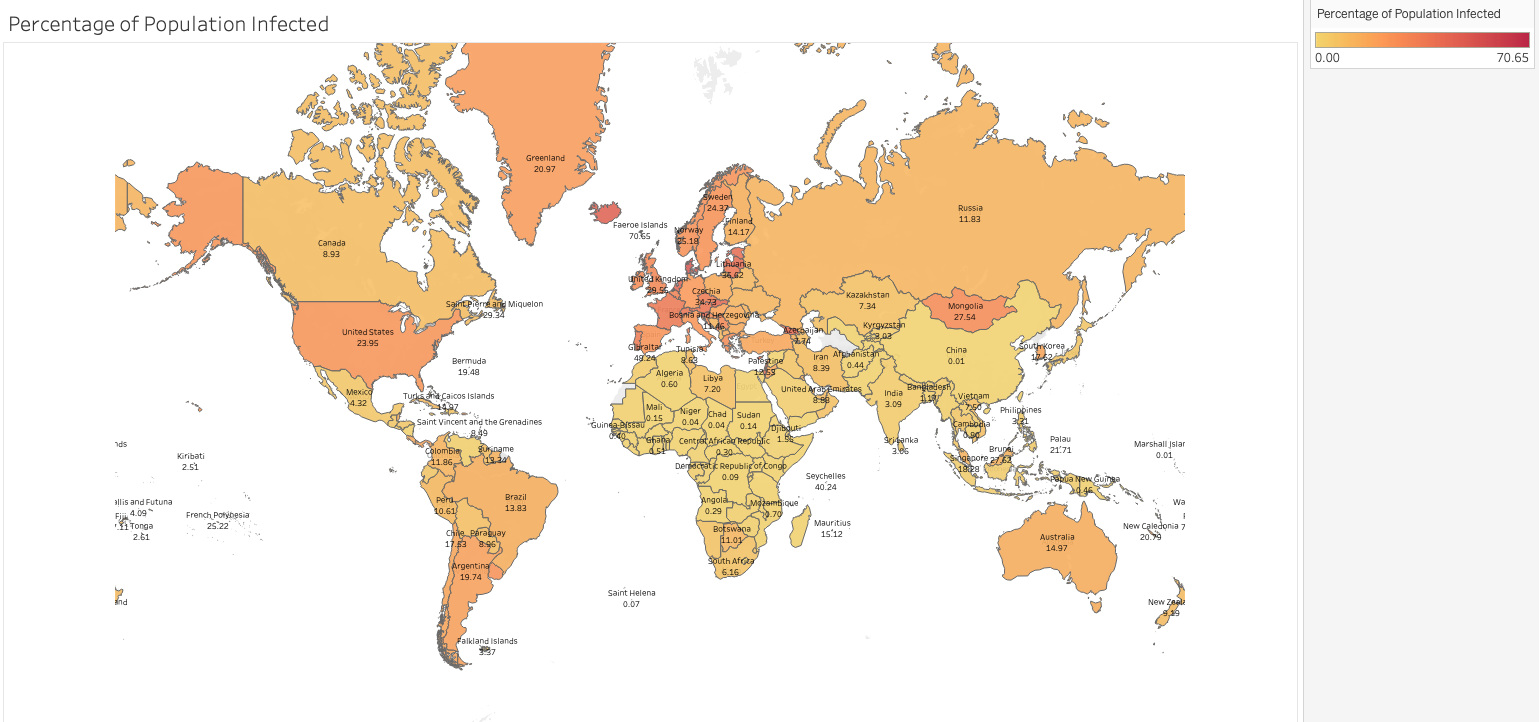
Q1) How has the infection rate changed over time in Germany?
This query does not show the percentage of infected people at a given moment in time in Germany. Rather, it is a running total of all people who have been infected as a percentage of the population. This means that people who have recovered from Covid are not subtracted from the total.
SELECT
      location,
      date,
      total_cases,
      (total_cases/population)*100 as '% of Cases'
FROM
      deaths
WHERE
      location = 'Germany'
For visualisation purposes, I thought it would be more useful to show the global infection rate (that follows the above definition) as of 18/03/2022 (zoom in):
Q2) How has the mortality rate evolved over time in Germany?
select
      location,
      date,
      total_cases,
      total_deaths,
      round(((total_deaths/total_cases)*100), 2) as 'Mortality Rate'
from
      deaths
where
      location = 'Germany'
order by
      1, 2
Q3) What is the deadliest month on average in Germany?
select
      location,
      month(date),
      round(avg((total_deaths/total_cases)*100), 2) as morality_percentage
from
      deaths
where
      location = 'Germany'
group by
      location, month(date)
order by
      morality_percentage DESC
Insight: The data suggests that the summer months have the highest mortality rate. One possible interpretation of this is that people tend to be most social and outgoing in the summer to enjoy the weather. As more people visit public places, the likelihood of the virus transmitting is greater.
But that doesn’t explain why mortality is higher. Perhaps older segments of population visit public places more and get infected, and older people are more likely to die from Covid due to weaker immune systems as a result of advanced age.
Q4) In which countries are you most likely to die from Covid today?
This data was obtained on 2022-03-18, so that is the date that will be considered ‘today’
select
      location,
      date,
      (total_deaths/total_cases)*100 as Mortality_Rate
from
      deaths
where
      date = '2022-03-18'
order by
      Mortality_Rate DESC
limit
      5
Part 2 - Continent and Global-level analysis
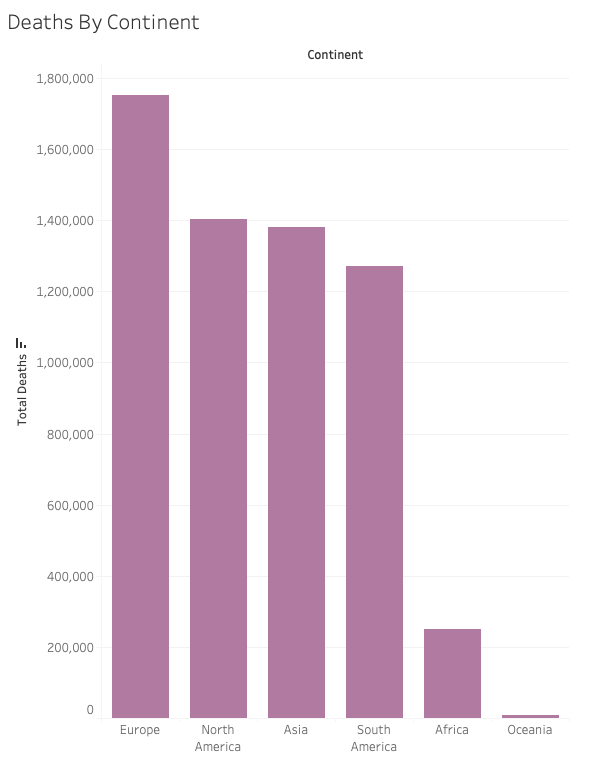
Q5) What are the global death figures by continent?
select
      location, max(total_deaths) as total_continent_deaths
from
      deaths
where
      continent is null and
      location not in('High income', 'European Union', 'Low income')
group by
      location
order by
      total_continent_deaths desc
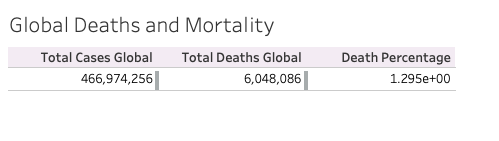
Q6) Total global cases and deaths
select
      sum(new_cases) as total_cases_global,
      sum(new_deaths) as total_deaths_global,
      (sum(new_deaths)/sum(new_cases))*100 as death_percentage
from
      deaths
where
      continent is null and
      location not in('European Union', 'High income', 'Low income')
Q7) How many vaccine doses have been administered as a percentage of population?
with cte1 as(

     select
          a.continent,
          a.location,
          a.date,
          a.population,
          b.new_vaccinations,
          sum(b.new_vaccinations) OVER (Partition by a.location
          order by a.location, a.date) as vacc_so_far
     from
          deaths a
     inner join
          vaccinations b using(location, date)
     where
          a.continent is not null)

select
      location,
      date,
      population,
      new_vaccinations,
      vacc_so_far,
      (vacc_so_far/population)*100 as percent_pop_vaccinated
from
      cte1
Let’s create a view so we can access these results easily next time
Create view
create view global_vaccination_rate as

with cte1 as(

      select
            a.continent,
            a.location,
            a.date,
            a.population,
            b.new_vaccinations,
            sum(b.new_vaccinations) OVER (Partition by a.location
            order by a.location, a.date) as vacc_so_far
      from
            deaths a
      inner join
            vaccinations b using(location, date)
      where
            a.continent is not null)

select
      location,
      date,
      population,
      new_vaccinations,
      vacc_so_far,
      (vacc_so_far/population)*100 as percent_pop_vaccinated
from
      cte1
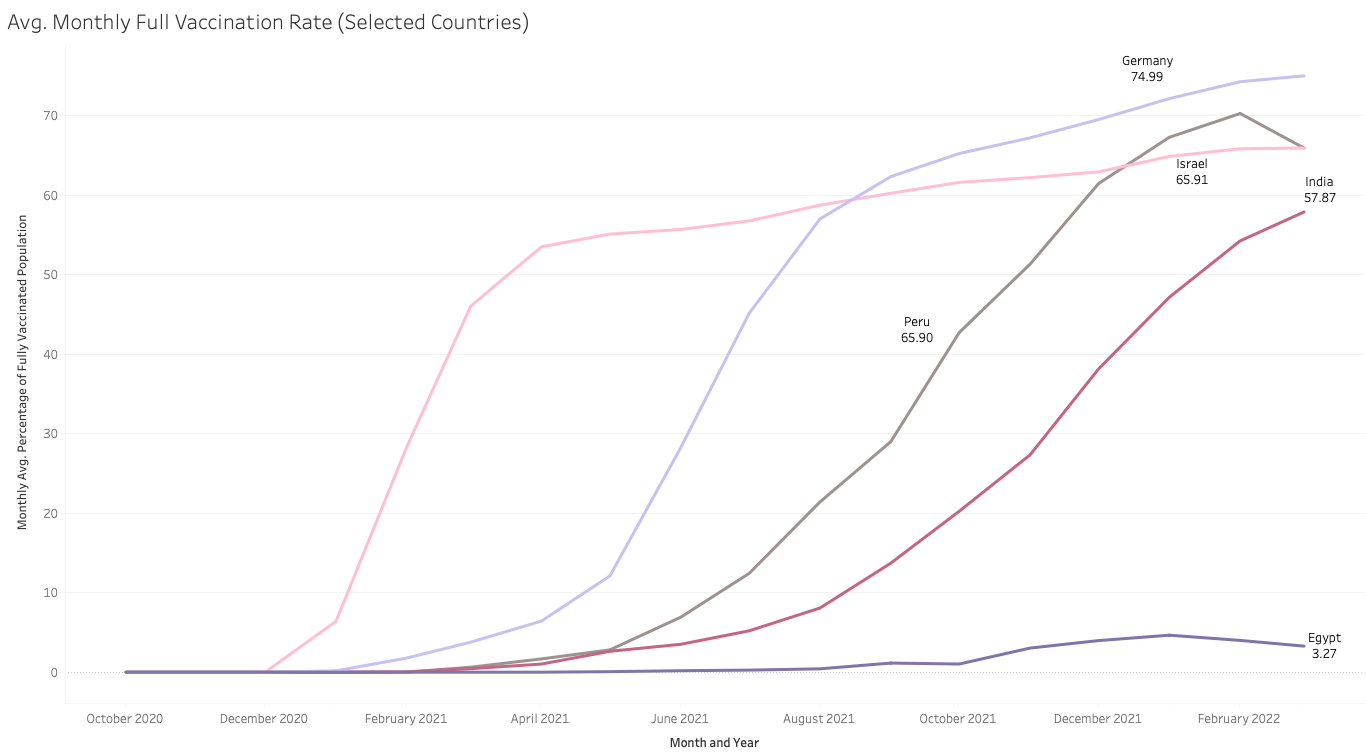
Q8) How have vaccination rates for countries changed over time?
create view global_vaccination_rates1 as

select
      b.location,
      a.population,
      b.date,
      max(b.people_vaccinated) as total_partial_vaccinations,
      max(b.people_fully_vaccinated) as total_full_vaccinations,
      (max(b.people_fully_vaccinated)/a.population)*100 as percentage_fully_vaccinated
from
      deaths a
inner join
      vaccinations b using(location, date)
group by
      a.population, b.location, b.date
For visualisation purposes, I have chosen only a few countries for clarity
# Q9) Which country has had the most severe cases of covid?
select
      location,
      sum(total_cases) as total_cases,
      max(total_cases/population)*100 as '% of Cases',
      sum(icu_patients) as total_icu_patients
from
      deaths
where
      continent is not null
group by
      location
order by
      4 DESC