
SQL & Tableau Project: - Analysing Performance of an E-Commerce Business
Note: This project displays the following SQL & Tableau skills:
- Filtering
- Joins
- Grouping and Aggregation
- CTEs
- Derived tables
- Subqueries
- Views
- LODS (Level of Detail Expressions)
A dashboard can be found here
Introduction
This analysis is conducted on a Mexican E-commerce store called Maven Toys and uses SQL and Tableau for querying the data and visualisation, respectively.
The purpose of this is to extract insights that can shed light on current business performance and better inform future business decisions. These may range from learning about things such as which store to promote, which products tend to perform better in some months compared to others, whether or not money tied up in inventory could be managed better and more.
The queries are in 3 parts:
- Products and Profitability
- Seasonality
- City-level and Stock Analysis
A short summary of this project, including information on the data tables, columns, data types and data source can be found in a GitHub repository README file.
Part 1 - Data Cleaning
Here I’m going to remove the dollar sign ‘$’ in the ‘product_cost’ and ‘product_price’ columns, then change type to ‘double’. This is done so that we can perform calculations with the data in these columns.
update products
set product_cost = replace(product_cost, '$','')

update products
set product_price = replace(product_price, '$','')

alter table products
modify product_cost double

alter table products
modify product_price double
Part 2 - Products and Profitability
Q1) Which 5 products have generated the most profit?
select
      a.product_name,
      round(sum((a.product_price-a.product_cost)*b.units), 2) as total_profit
from
      products a
inner join
      sales_toys b using(Product_ID)
group by
      a.product_name
order by
      total_profit desc
limit
      5
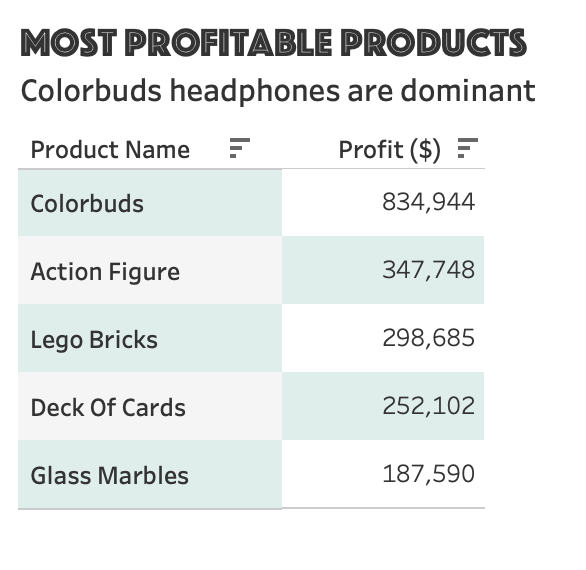
Colorbuds, which are a type of earphones, were more profitable than the next two most profitable products combined.
Interpretation & Takeaway
Among the 5 most profitable products, Colorbuds account for 43% of all profit, a significant amount. If combined with Action Figures, the second highest profitable product, nearly 62% of profit is accounted for.
If compared to total profit across all products, Colorbuds are responsible for just over 20% of this figure.
It may be tempting to recommend that Maven Toys should consider focusing on these two products in marketing campaigns, for example, at the expense of other products. However, without further information, we cannot make this recommendation.
For example, it may be the case that one or more of the other products serves as a loss leader. Loss leaders, as we know, are products that are intentionally sold at a lower price point, sometimes even below cost price, in order to attract customers to the company. The company can sell cross-sell other, higher-priced/more profitable products to the same customers as a result.
Therefore, the presence of the loss leader may actually be critical to overall profits because without them, the company may not attract as many customers in the first place. It may be the case that one of Lego Bricks, Deck of Cards & Glass Marbles serves as a loss leader. Completely neglecting one of these in favour of the 2 most profitable products may result in lower overall profits.
In conclusion, if the company has knowingly placed one of these products as a loss leader then ceasing its promotion is not advisable. Conversely, if this is not the case, then the company may run an A/B test online to verify whether further promoting Colorbuds or Action Figures leads to an increase in overall profit
Q2) What product category is the most profitable overall?
select
      a.product_category,
      round(sum((a.product_price-a.product_cost)*b.units), 2) as total_profit
from
      products a
inner join
      sales_toys b using(Product_ID)
group by
      a.product_category
order by
      total_profit desc
Interpretation & Takeaway
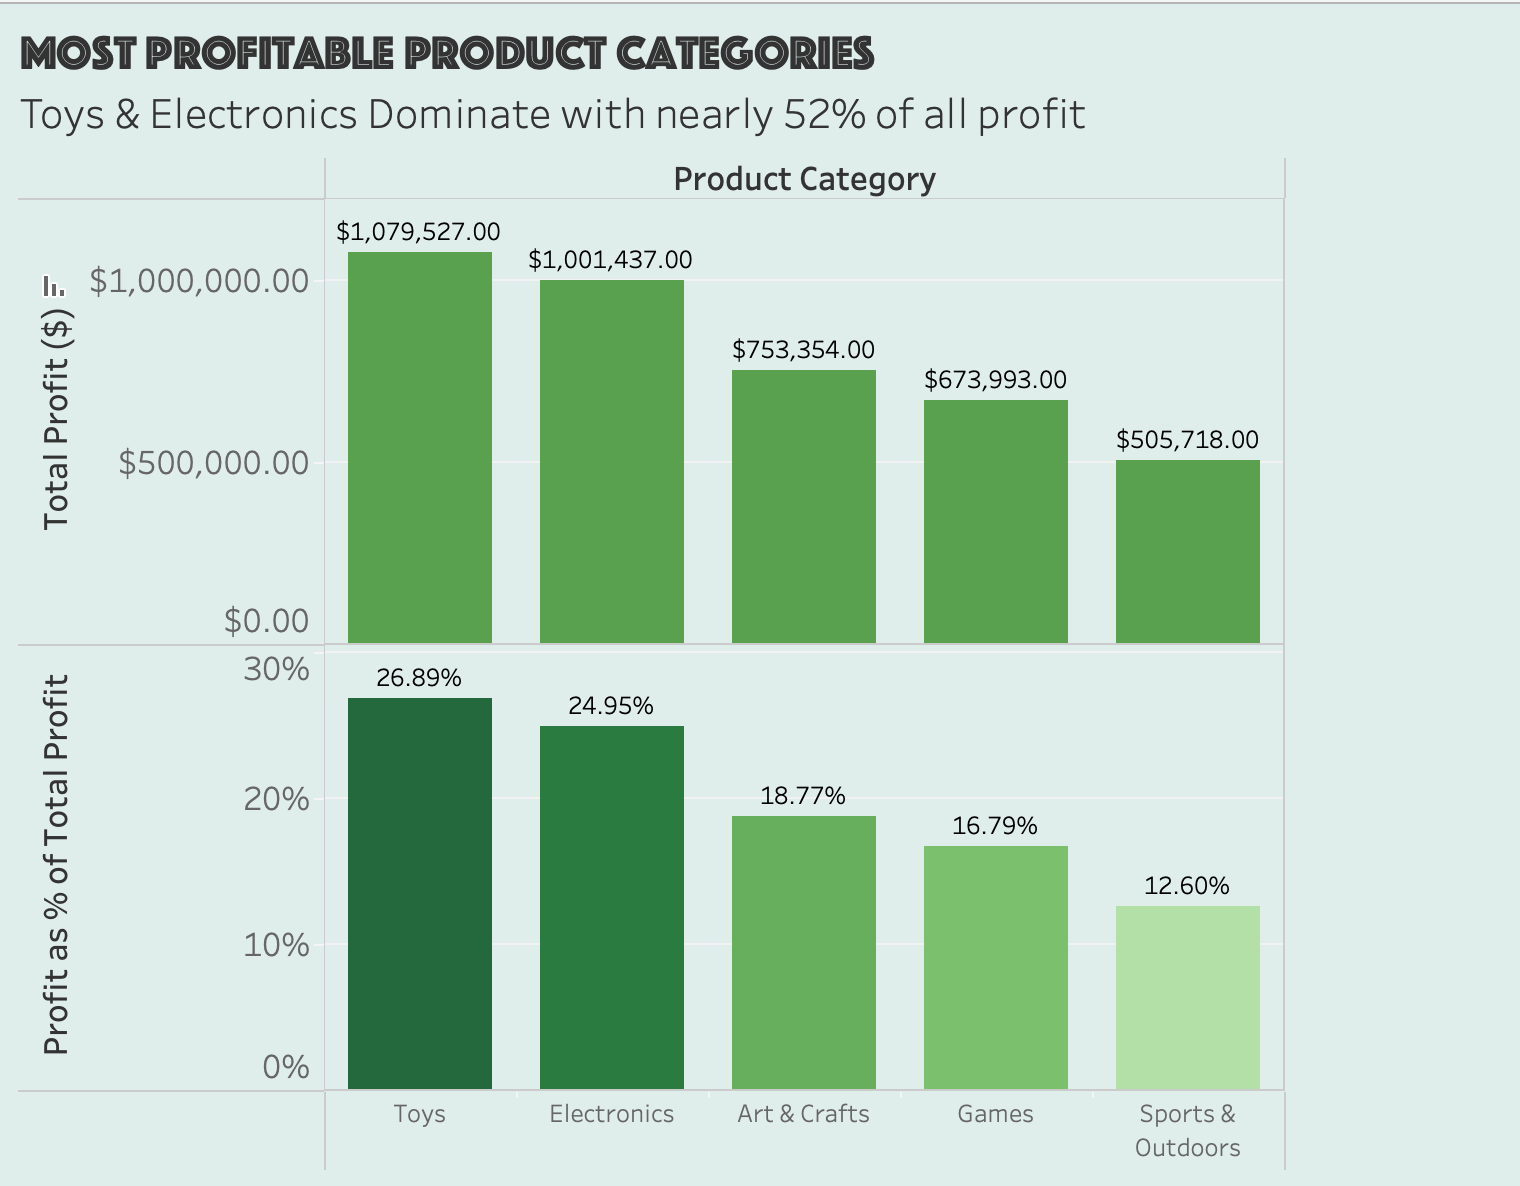
Toys and Electronics are the best-performing categories when it comes to total profit, accounting for nearly 52% of all profit. The two products (not product categories) that generated the greatest amount of profit belong to these 2 product categories (Colorbuds = Electronics & Action Figure = Toys)
Sports & Outdoors generated just over half a million dollars in revenue, being the least profitable category. Combined with the findings in Query 5, we see that there could be an opportunity to focus on manufacturing new Sports & Outdoors products that take sell better in Winter. This could be something as simple as skis & snowboards for children.
Q3.5) Do Toys and Electronics generate the most profit across all stores, or do certain categories generate more profit depending on the store?
To visualise this, we need to write a Level of Detail Expression (LOD) because the data is at a per-sale level while the visualisation we require is at a per-store and per-category level. I need to find the proportion of profit each product category is responsible for per-store, not across all stores
{fixed [Store Name], [Product Category]: sum([Profit])} / { fixed [Store Name] : sum([Profit])}
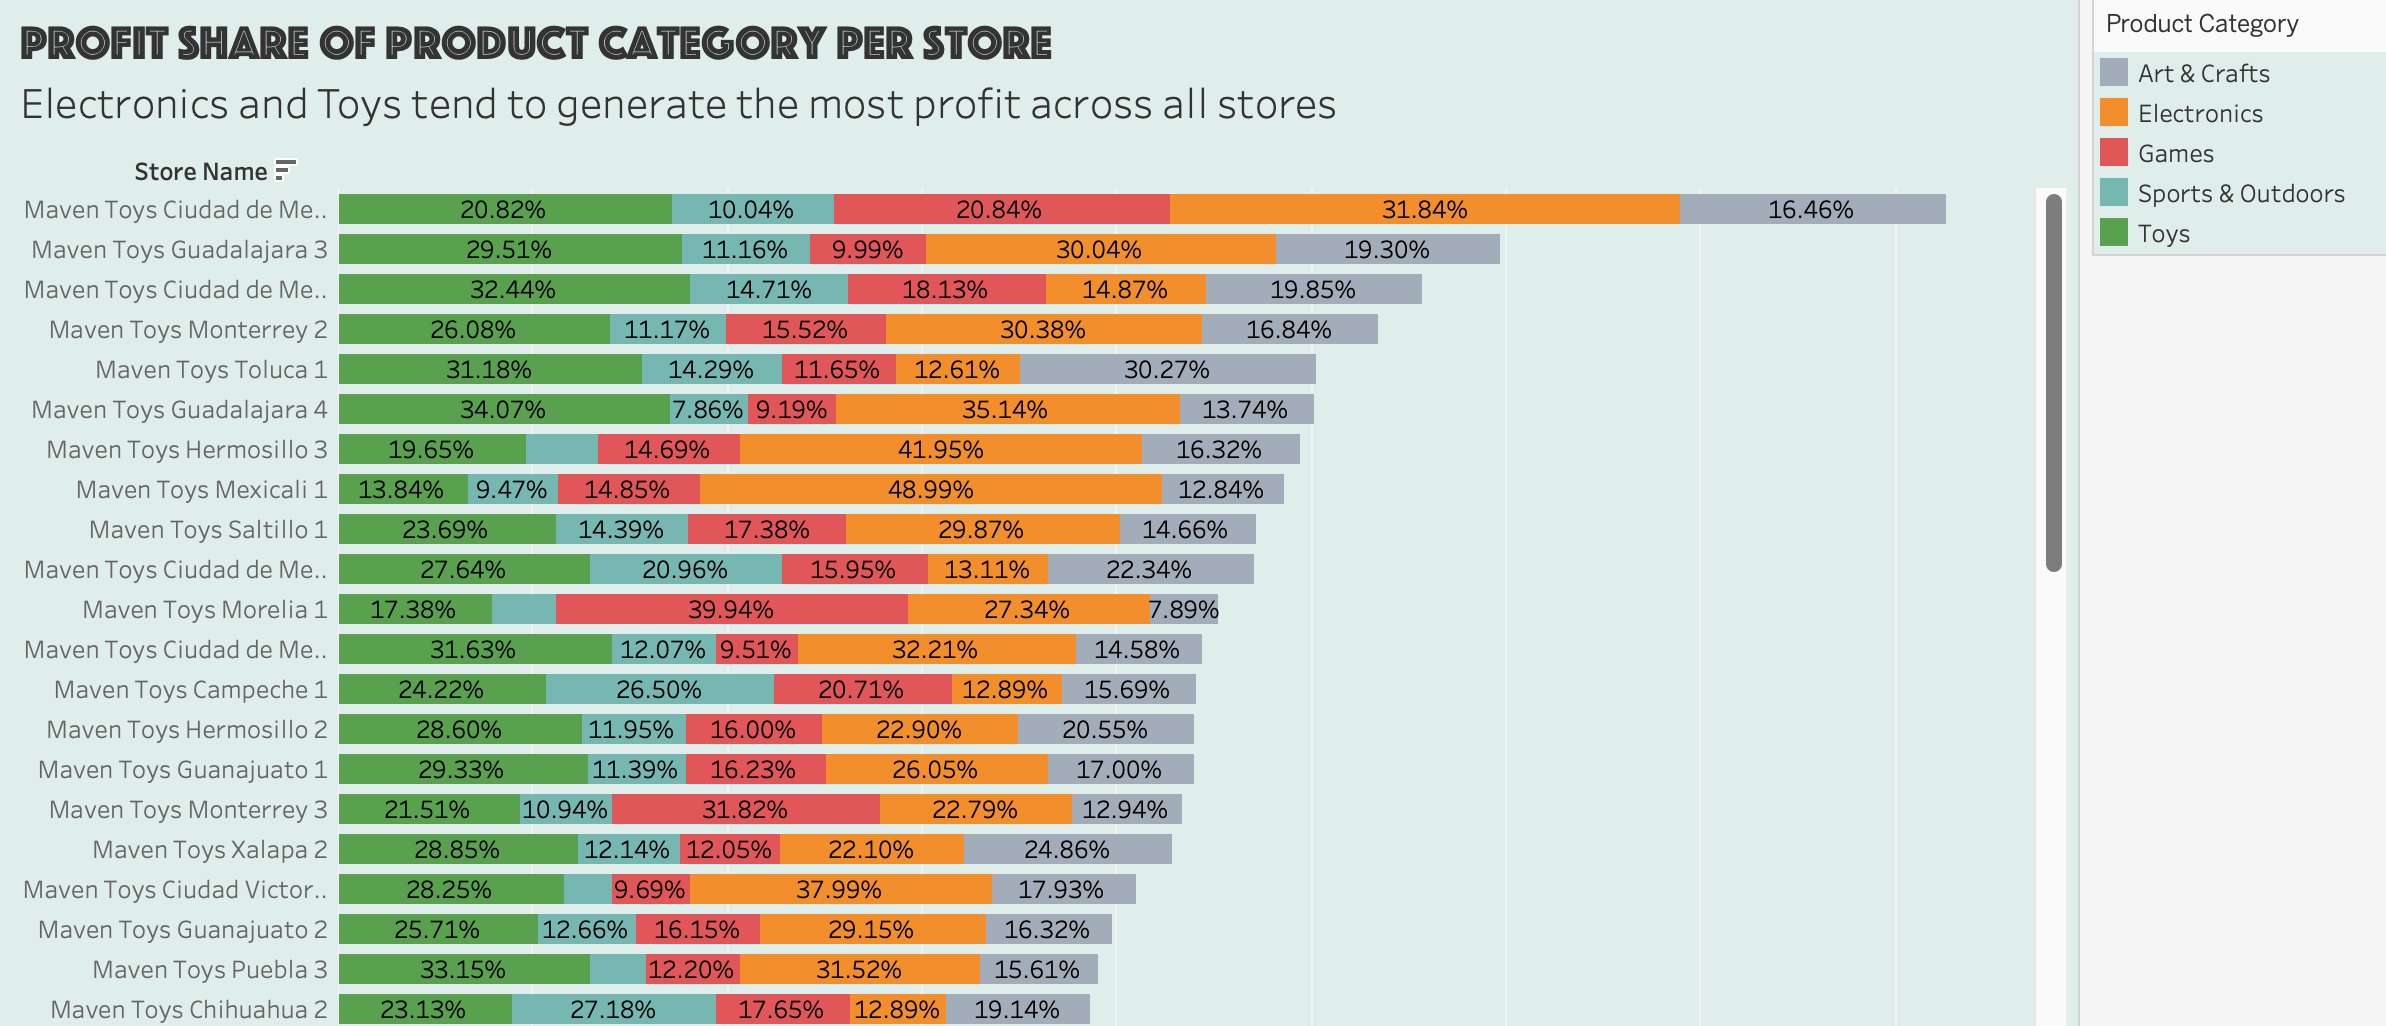
We see that Electronics and Toys are consistently responsible for generating the largest proportion of profit per store. There are only a few exceptions to this, such as in the store named “Maven Toys Morelia 1”, where Games dominate and generate almost 40% of the profit for the store.
For Maven Toys it may be exploring adding more items under the Electronics and Toys categories to give customers even more choice and take full advantage of the popularity of these categories
Q3) What products are high margin and which ones are low margin?
select
    product_name, round(product_price-product_cost, 2) as margin,
    case when (product_price-product_cost) > 5 then 'High Margin' else 'Low Margin' end as Status
from
    products
order by
    margin desc
Interpretation & Takeaway
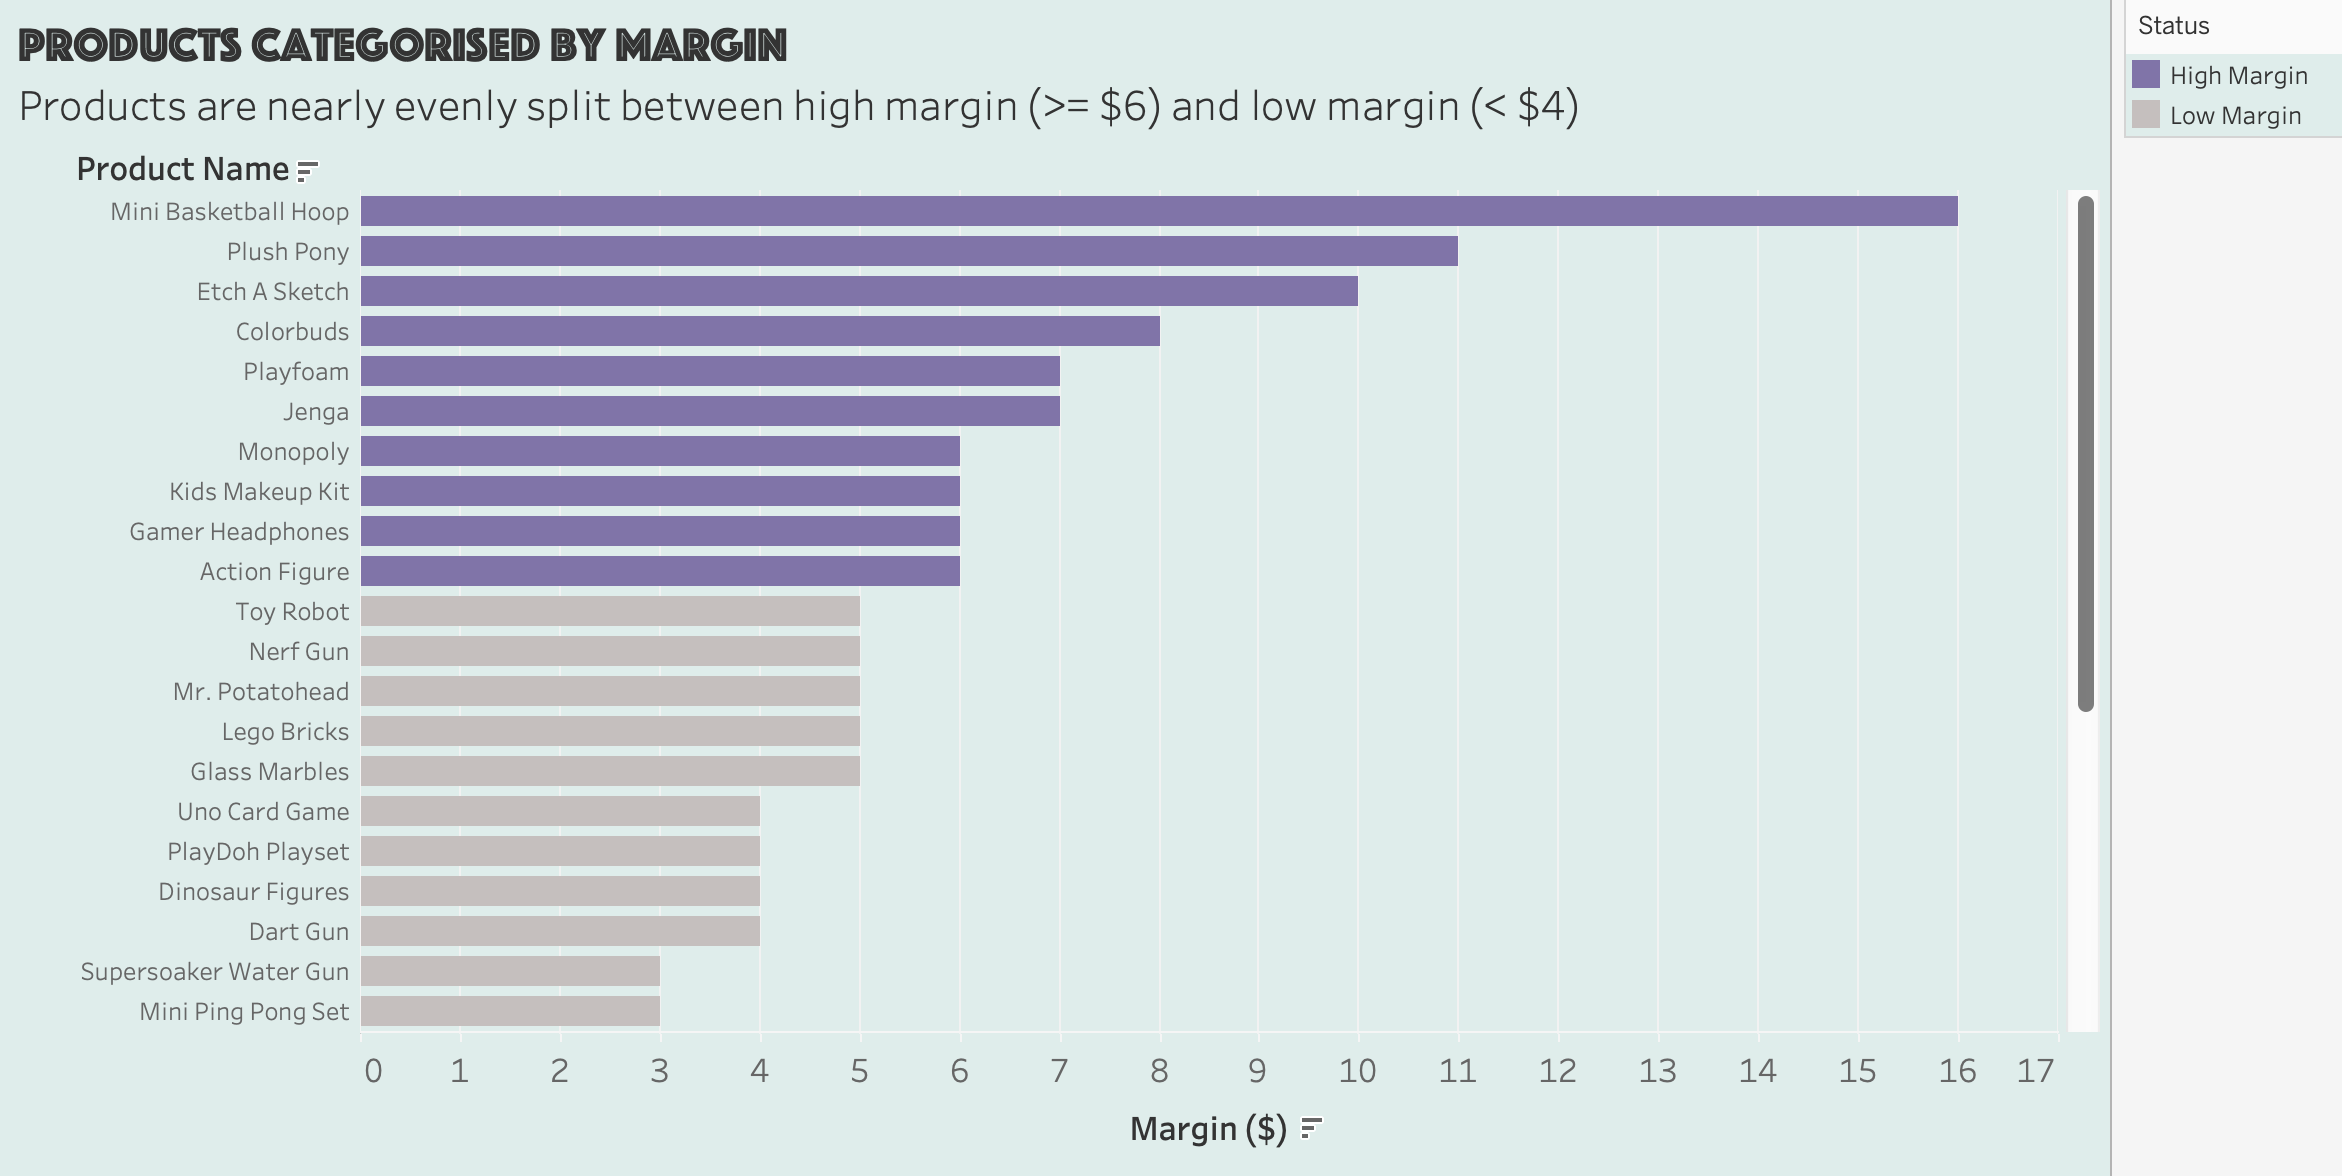
Products are split into high and low margins nearly evenly.
The criteria of a high margin product is that the selling price is at least $6 greater than the cost price. I chose this figure based on the distribution of margins across all products, but it is still fairly arbitrary.
Interestingly, only 2 products from the 5 most profitable products list (Colorbuds & Action Figures) are high-margin, so let’s explore the relationship (if any exists) between the size of product margin and profitability
Q4) Are high margin products more profitable? Or are low margin products more profitable?
-- find the total profit and margin for each product

with cte1 as(

    select
          a.product_name,
          round(sum((a.product_price-a.product_cost)*b.units), 2) as total_profit,
          max(round(a.product_price-a.product_cost, 2)) as margin
    from
          products a
    inner join
          sales_toys b using(Product_ID)
    group by
          a.product_name
    order by
          total_profit desc)

select
    cte1.product_name,
    cte1.total_profit,
    cte1.margin, # get the results from above CTE and label each product as 'high' or 'low' margin
    case when cte1.margin > 5 then 'High Margin' else 'Low Margin' end as Status
from
    cte1
order by
    total_profit DESC, margin desc
Interpretation & Takeaway
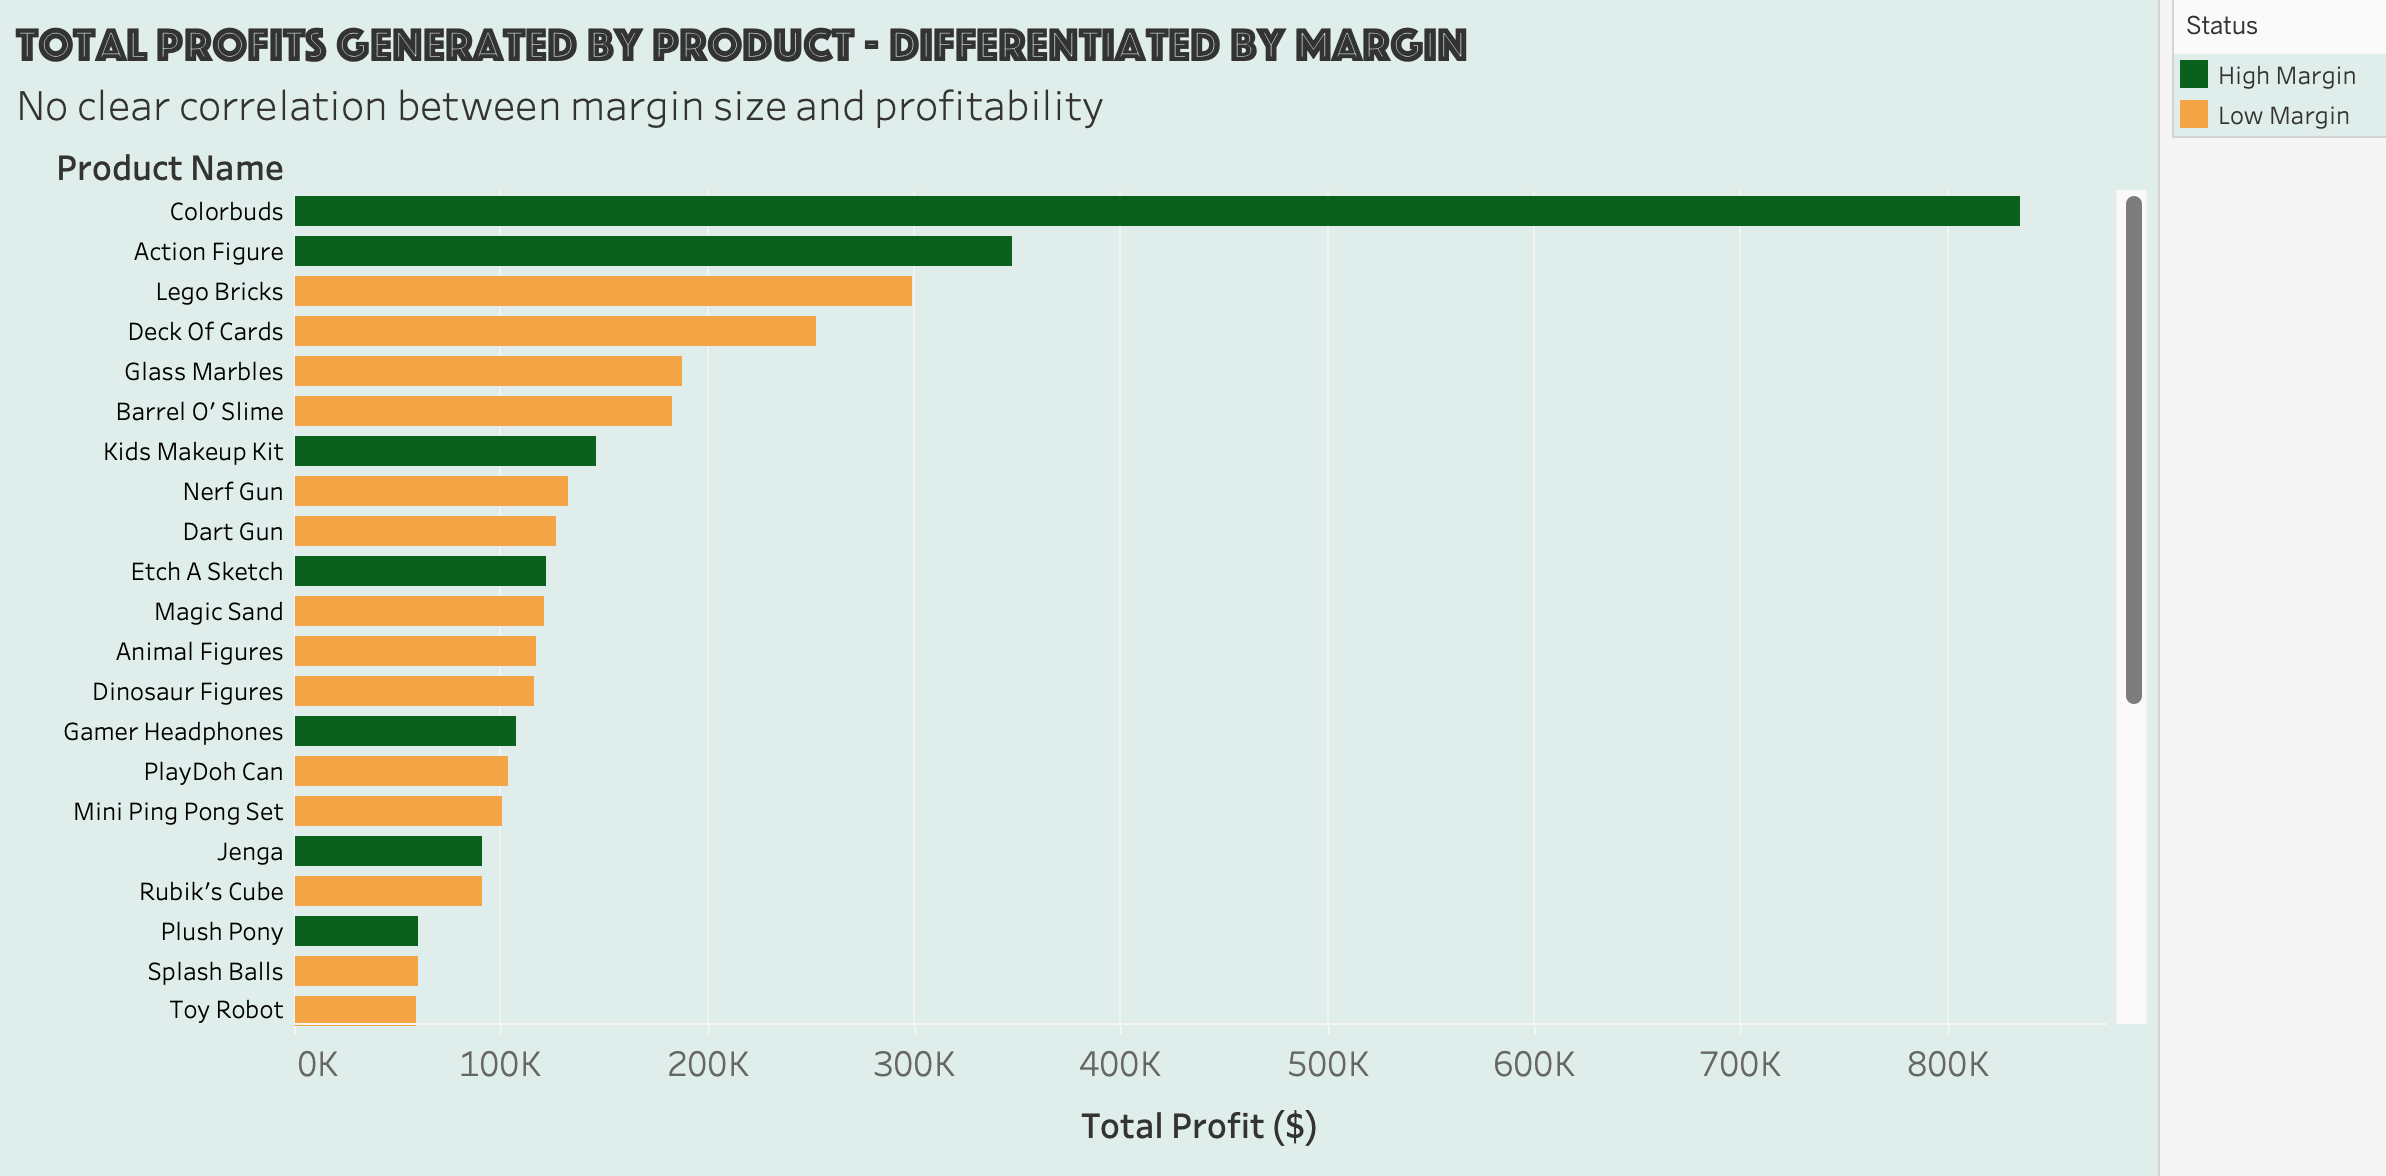
We see that top 2 most profitable products, Colorbuds and Action Figures, are considered to be high-margin products while the next 3 most profitable products are low margin.
The graph shows us that beyond these first 2 products, there seems to be little to no correlation on a per-product basis between profit and whether or not the product is low- or high-margin. It may be the case that there is an additional factor, beyond the fact that they are high-margin products, that may be influencing why Colorbuds and Action Figures are so profitable.
What I want to do now is compare the total, average profit and average units sold per sale across high-margin products and compare those with the same calculations for low-margin products. Just to make it a little more objective, I am going to exclude “Colorbuds” in this visualisation, because it is a clear outlier:
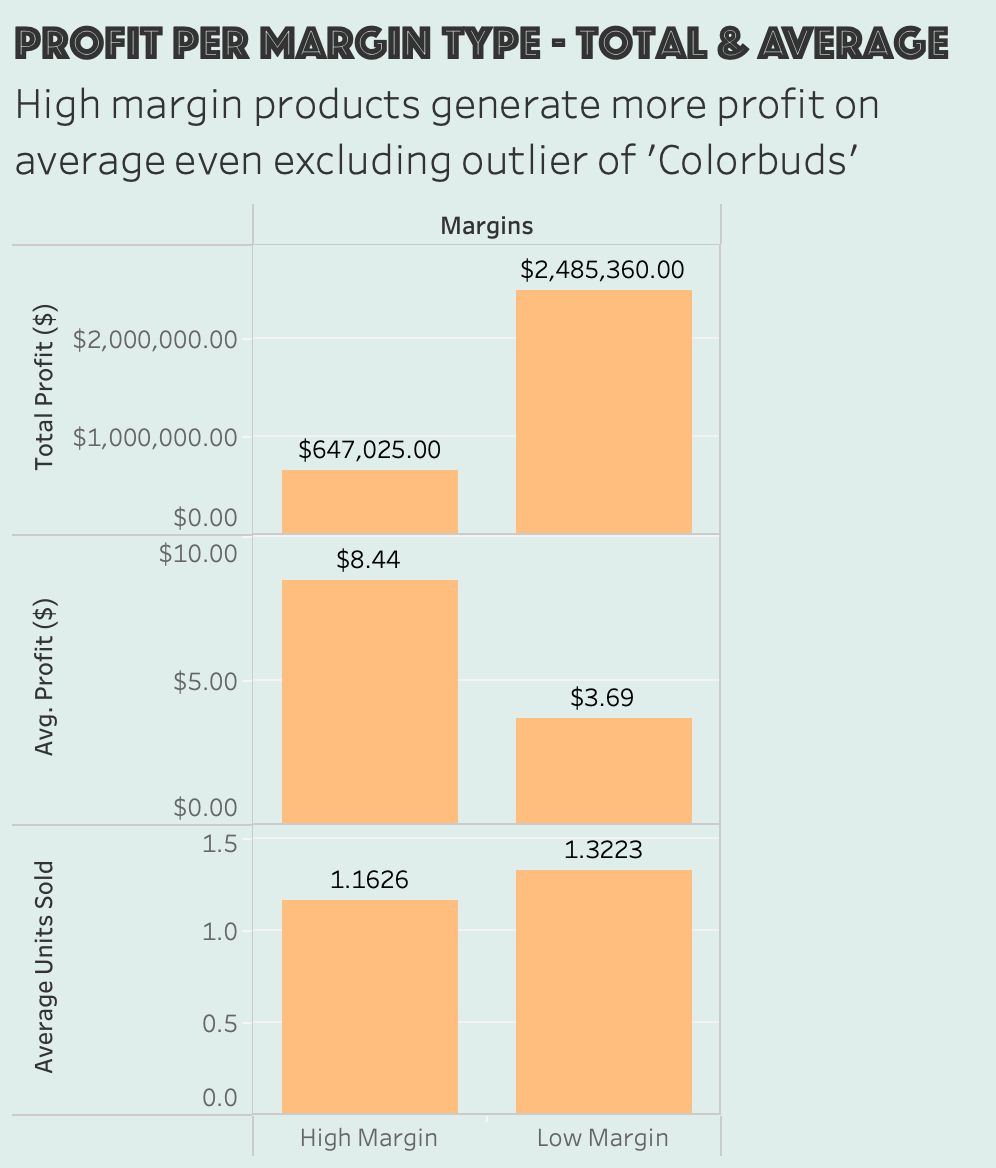
While low-margin products make significantly more total profit overall, high-margin products generate more profit on average, on a per sale basis, even when we exclude ‘Colorbuds’ from the calculation
This may seem like an obvious conclusion; if high-margin products have a greater difference between sale and cost price (as is their very definition), then of course they generate more profit per sale on average. However, price is inversely correlated with quantity demanded from the point of view of customers. And of course, profit equals (price-cost)*quantity, so quantity sold per sale matters.
According to economic theory, customers should be buying proportionally more low-margin goods per sale, but we see that this isn’t the case. Lower-margin products sell only 0.16 units more per sale than high-margin products on average.
Overall, this suggests that higher-margin products are inherently more attractive to customers and they are inherently more profitable on average. This suggests that for Maven Toys, it is worth exploring whether they can sell additional high-margin products, provided that customer demand and market research also back this decision up.
Part 3 - Seasonality
Q5) Is there a seasonality aspect to sales?
The date range of the data is 2017-01-01 to 2018-09-30. This means that all months apart from October, November and December have two months worth of data (once for 2017 and once for 2018).
select DATE_FORMAT(a.date, '%Y-%m'),
     round(sum(a.Units*b.product_price), 2) as total_monthly_revenue
from
     sales a
inner join
     products b on a.Product_ID = b.Product_ID
group by
     DATE_FORMAT(a.date, '%Y-%m')
Interpretation & Takeaway
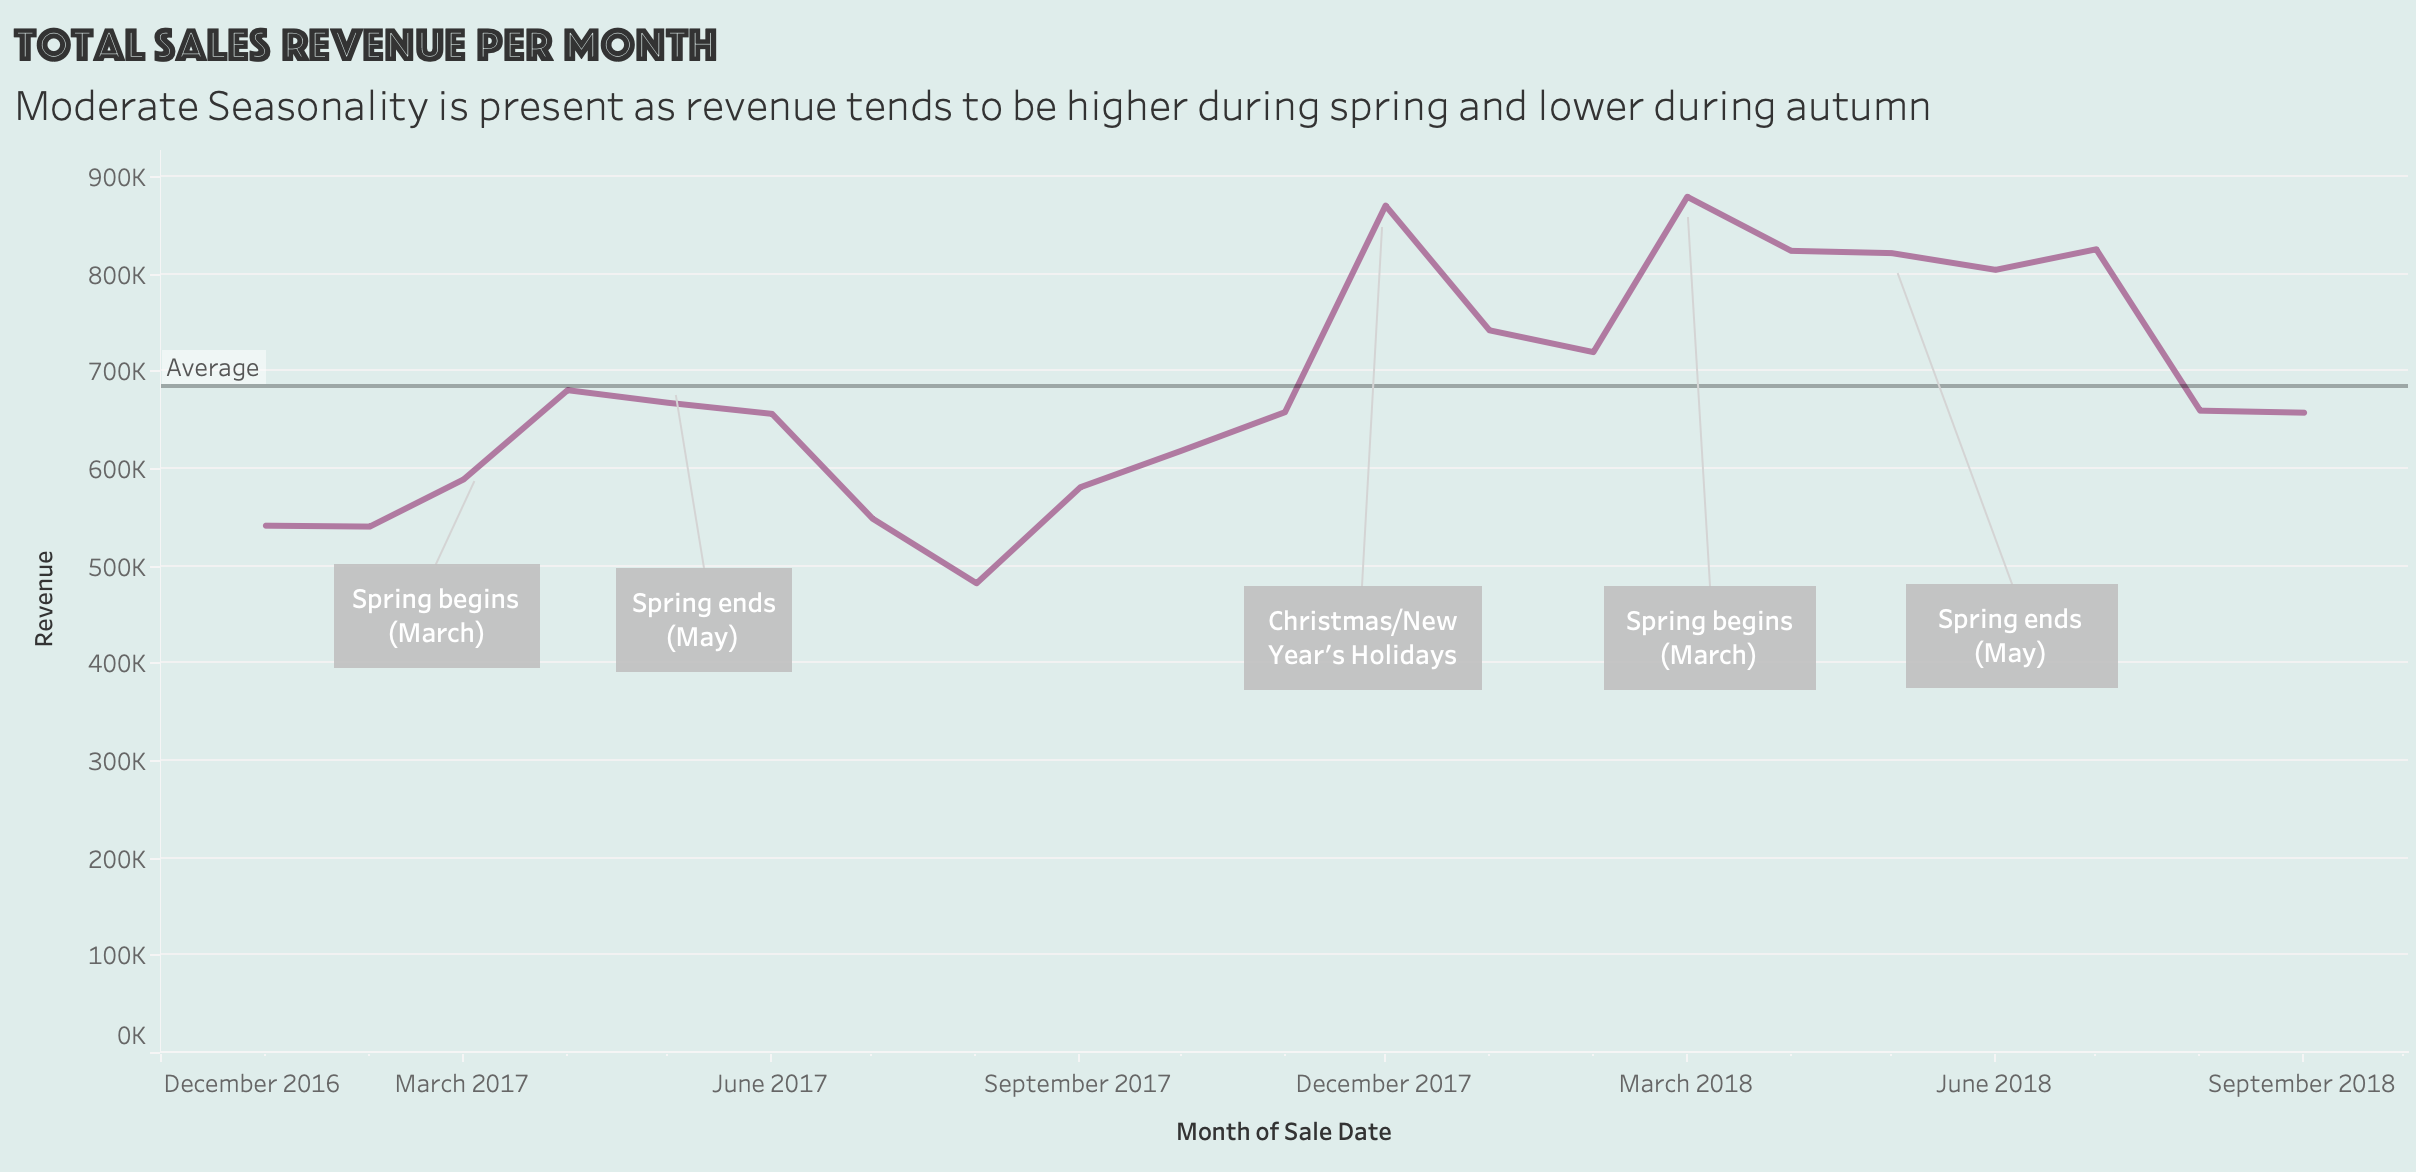
As we can see, there is a general uptick in sales revenue for Maven Toys during the Spring months. Apart from a sharp rise in revenue in December, which can be attributed to Christmas and New Year’s holidays, revenue is generally lower in the Winter and Autumn months than in Spring.
As before, one possible recommendation here for Maven Toys is to introduce new products that are likely to sell better in Spring & Winter (specifically to take advantage of the peak during the last week of the year). For example, specialised headphones that can be worn during Winter sports (such as skiiing) could prove to be popular during Winter.
Overall, these observations do seem to indicate there is an element of seasonality involved. However, we still need to be careful in making generalisations because we have less than 2 years of data. Our conclusions would be more valid if we had, say, 5 years’ worth of data. But for now it seems that the spring months are correlated with an uptick in sales for Maven Toys
Q6) Is there a difference in product category popularity between Summer and Winter months?
-- get revenue of winter months

with w as(

    select
          a.product_category,
          round(sum(a.product_price*b.units), 2) as total_revenue
    from
          products a inner join sales_toys b using(Product_ID)
    where
          month(b.date) in(1, 2, 12)
    group by
          a.product_category),

-- get revenue of summer months

s as(

    select
          a.product_category,
          round(sum(a.product_price*b.units), 2) as total_revenue
    from
          products a inner join sales_toys b using(Product_ID)
    where
          month(b.date) in(6, 7, 8)
    group by
          a.product_category)

-- collect the results of the above two CTEs, joining on product category

select
    w.product_category,
    w.total_revenue as winter_revenue,
    s.total_revenue as summer_revenue
from
    w
inner join
    s using(product_category)
Interpretation & Takeaway
Here we see some interesting phenomena.
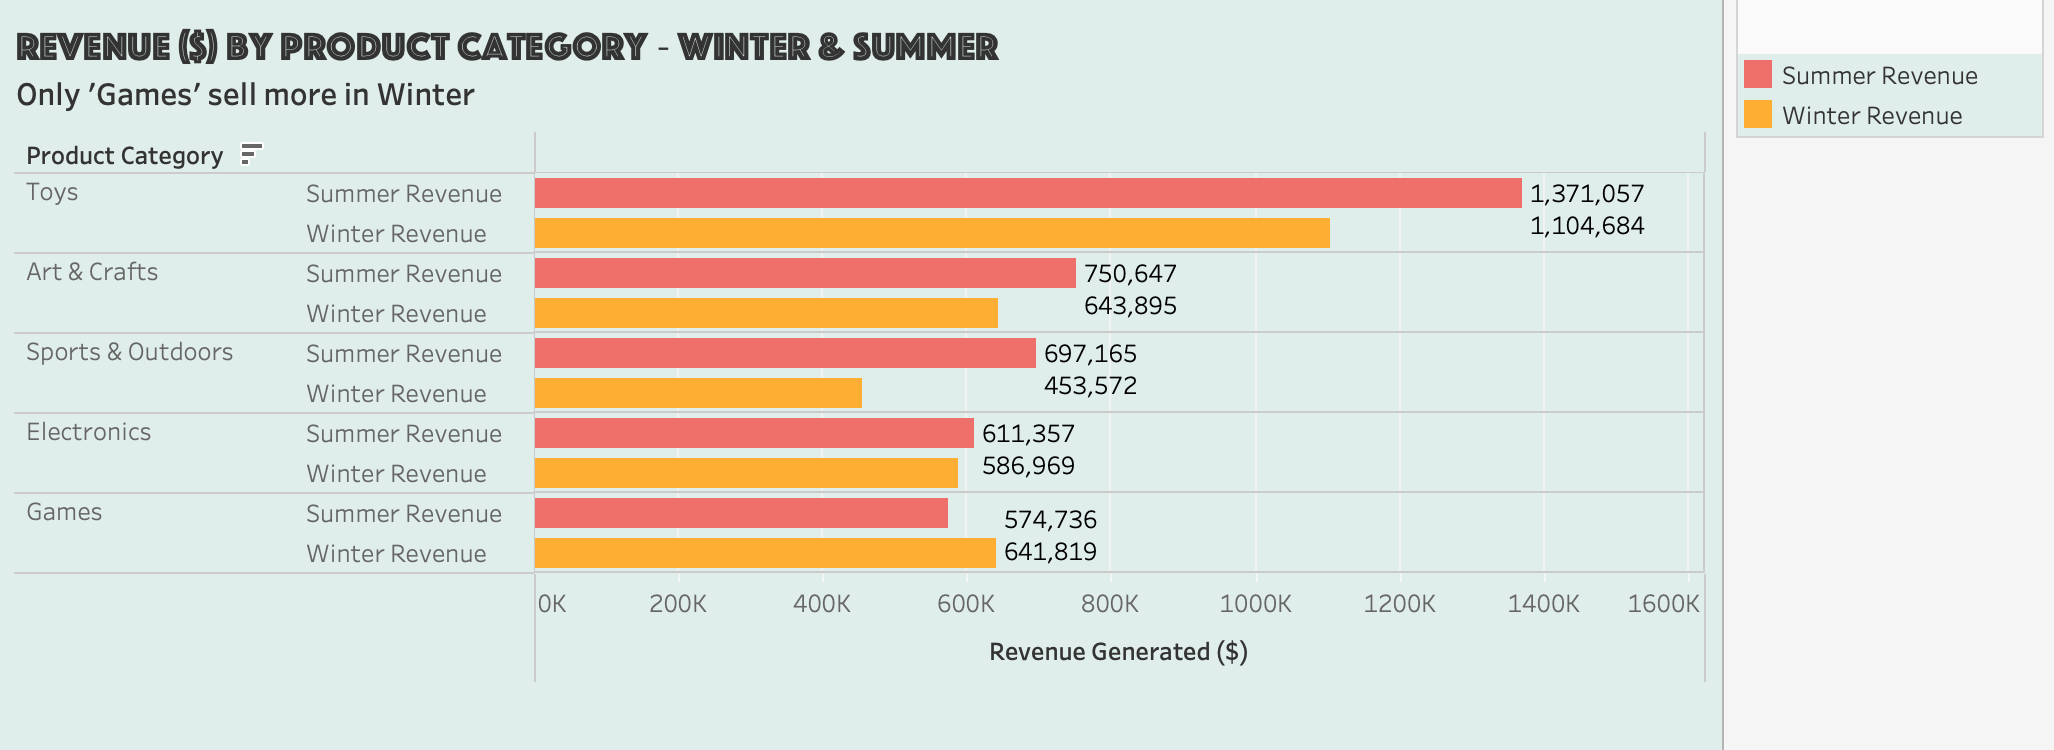
All categories bar Games sell better in Summer than in Winter. This makes sense as people are less likely to pursue outdoor activities in the Winter than in Summer, and games are primarily an indoor-oriented hobby/pastime.
Toys and Sports & Outdoors have the biggest differences in sales between Summer and Winter. Again, this is to be expected given most people’s inclination towards outdoor activities when the whether is warmer. In Summer, Toys sales are 24% greater than in Winter. This figure is about 54% for Sports & Outdoors
Electronics sales are nearly the same in Winter as in Summer, with Summer sales slightly higher while Games sales are nearly 12% higher in Winter than in Summer
Considering all of this, perhaps it is worthwhile considering promoting categories such as Toys and Sports & Outdoors more in the Summer in marketing campaigns, while doing the same for Games during Winter months. This may allow Maven Toys to take advantage of the higher demand for these categories during the appropriate months
Part 4 - City-level and Stock analysis
Q7) What cities generate the most revenue?
select
      s.Store_city,
      round(sum(p.product_price*t.units), 2) as City_Revenue
from
      stores s
inner join
      sales_toys t on s.Store_ID = t.Store_ID
inner join
      products p on p.Product_ID = t.Product_ID
group by
      s.Store_City
order by
      City_Revenue desc
Interpretation & Takeaway
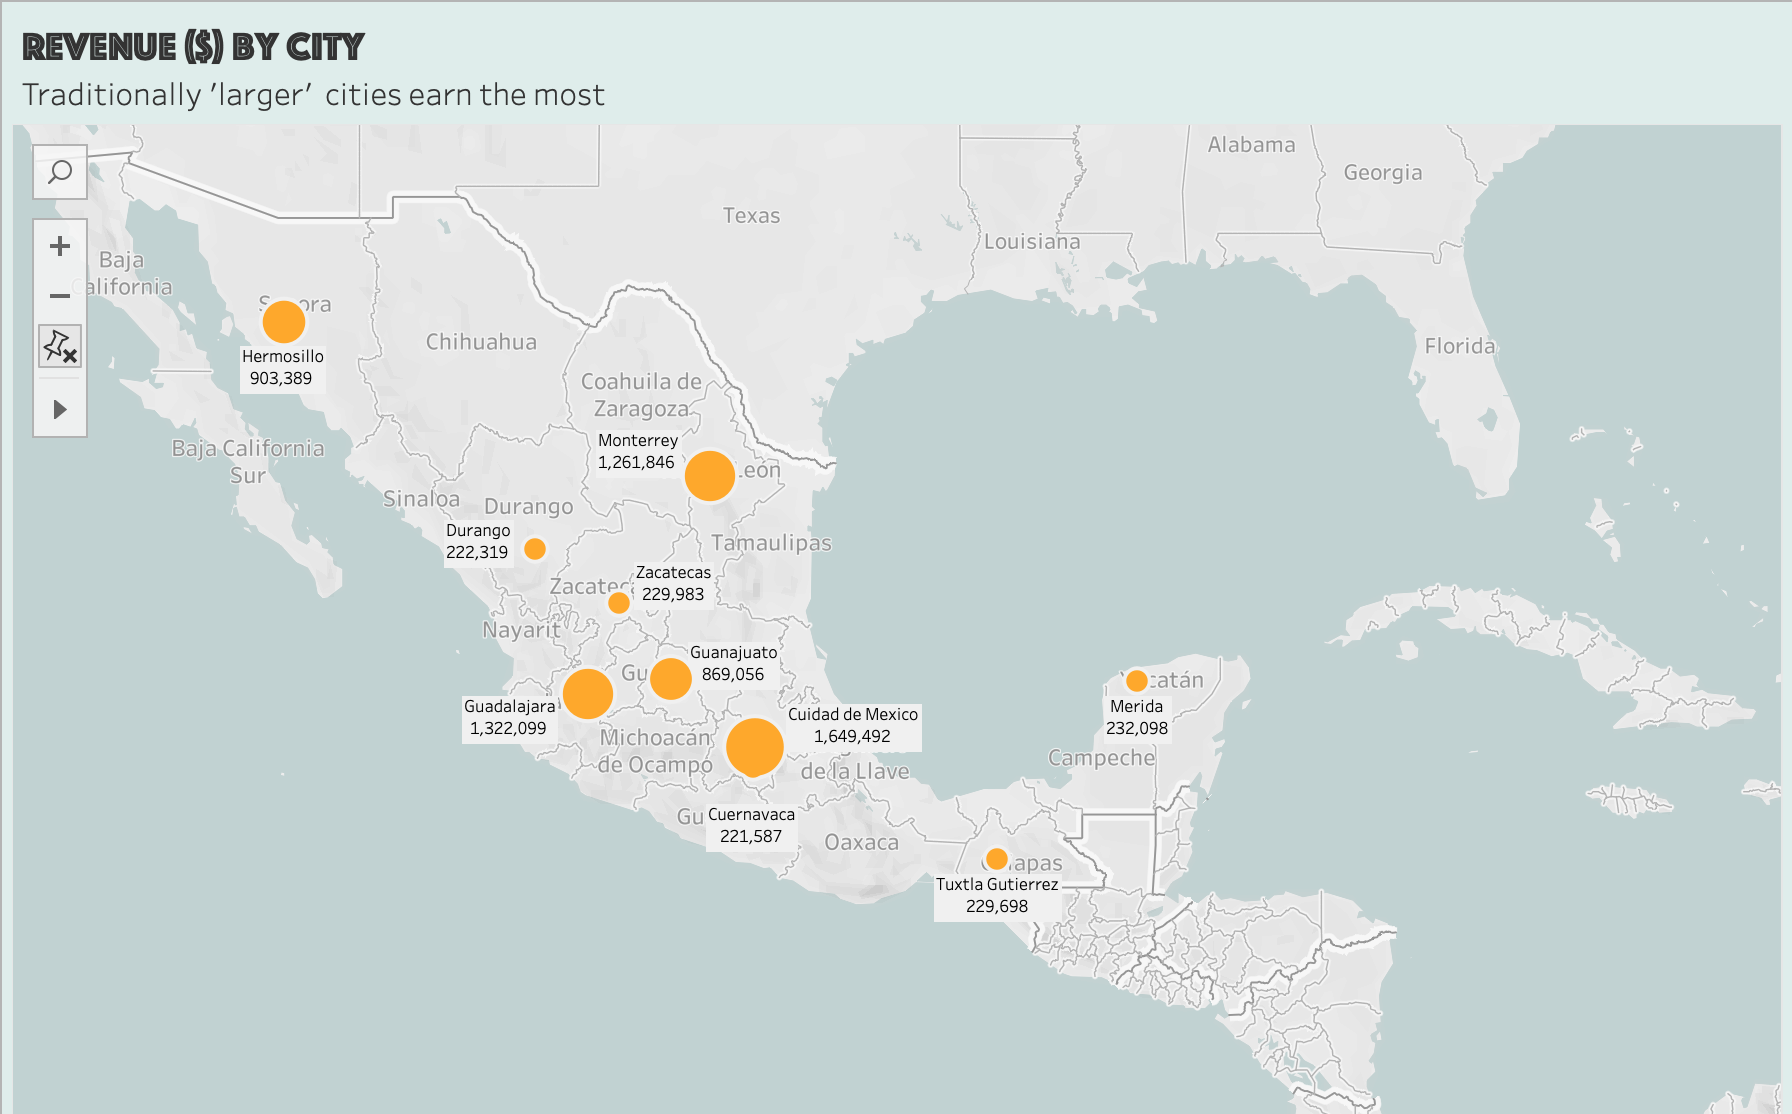
Maven Toys have their highest sales on a per-city basis in Mexico City (Ciudad de Mexico), Guadalajara and Monterrey. After cross-referencing the list of cities in which Maven Toys has branches with a list of the largest cities in Mexico by population, we can see that the largest cities in population terms are associated with the greatest sales.
Again, this is not a surprising finding as a large population means more potential customers. Larger cities also tend to be more urban and richer on average, so this may also have an influence.
What’s more interesting is that all cities other than Mexico City, Guadalajara and Monterrey in which Maven Toys has a presence are not counted among the 30 largest cities by population. What this could imply is that Maven Toys may consider opening a branch in a city with among the largest populations in Mexico, such as Tijuana or Leon, since population size and sales seem to be correlated for them.
For example, Tijuana has approximately 1.8 million people and Leon 1.6 million people. For comparison, Hermosillo, where Maven Toys sold $903,389 worth of goods, has approximately 900,000 people. So there could be a case made to expand to a larger city with potentially a larger customer base.
Q8) Are older (legacy) stores able to incorporate ecommerce technology well?
What we are asking is: are legacy stores providing the same level of success as newer stores, as measured by profit? The earliest store opening is in 1992 and the latest is in 2016. Let’s consider 2004 which is halfway between the two dates as the cutoff point which decides whether a store is considered ‘New’ or ‘Legacy’
with cte2 as(

      select
            s.Store_ID,
            s.Store_Name,
            round(sum(p.product_price*t.units), 2) as Store_Revenue
      from
            stores s
      inner join
            sales_toys t on s.Store_ID = t.Store_ID
      inner join
            products p on p.Product_ID = t.Product_ID
      group by
            s.Store_ID, s.Store_Name)

select
      cte2.Store_name,
      cte2.Store_Revenue,
      case when year(s.store_open_date) <= 2004 then 'Legacy Store' else 'New Store' end as Age_Status
from
      cte2
inner join
      stores s using(Store_ID)
order by
      Store_Revenue DESC
Interpretation & Takeaway
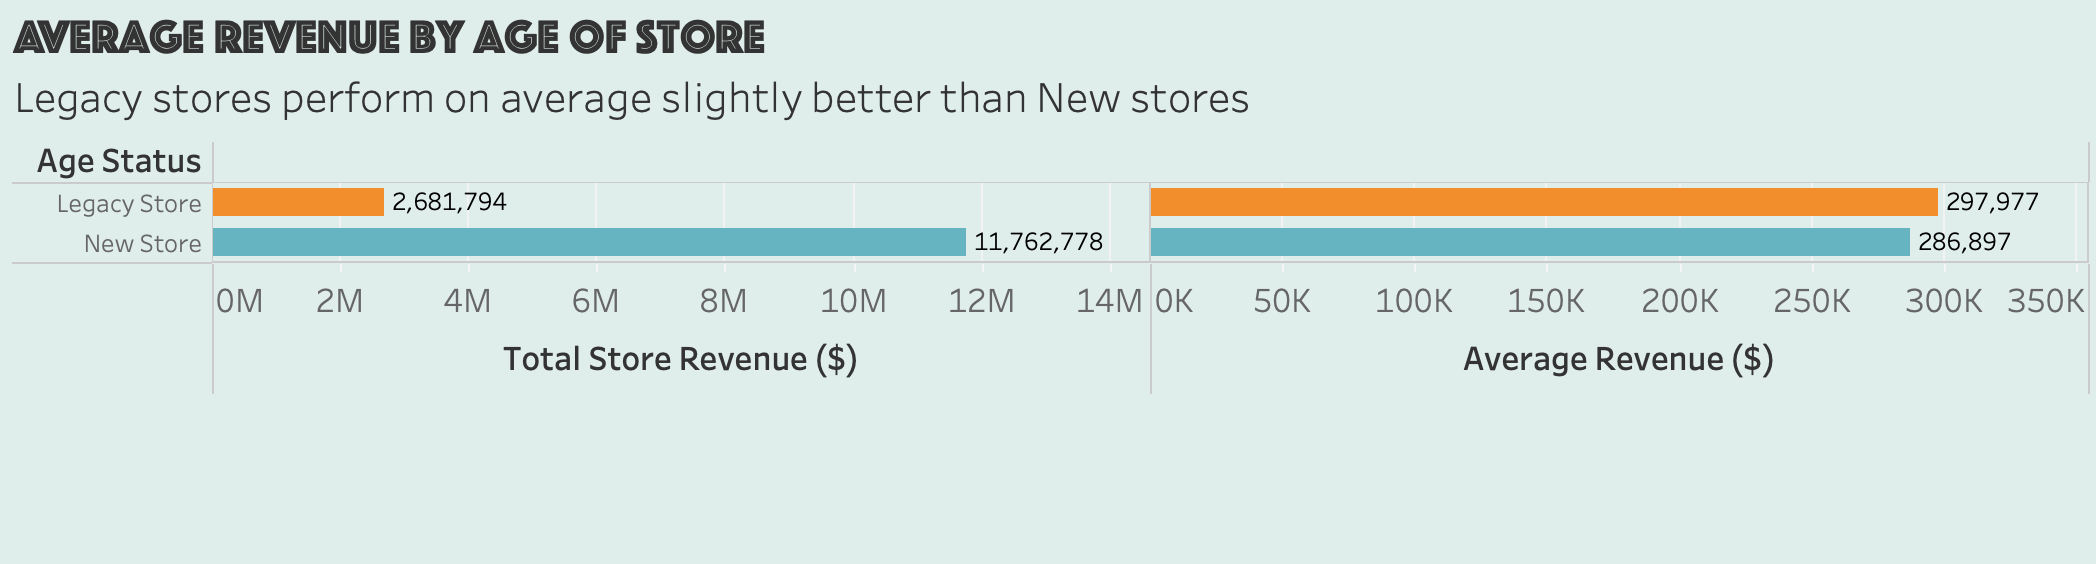
At first glance it seems New Stores overwhelmingly outperform Legacy Stores. However, this conclusion is incorrect because when we account for the total number of stores belonging to each type (there are far fewer Legacy stores compared to New stores), we find that Legacy stores actually outperform their newer counterparts on average. However, this difference is quite small, only about $11,000.
One interpretation of this is that Legacy stores have incorporated e-commerce technology quite well. Moreover, these stores are more established because they are older. This may contribute to the reasons why they perform better on average. Perhaps customers have a long-standing relationship with these older stores and more people are aware of their existence compared to newer stores. This in turn promotes more online orders and footfall.
Regardless, it seems as though Maven Toys is doing a good job of updating its older stores.
Q9) How much money is tied up in each store in the form of stock? Top 5 vs Bottom 5
Top 5:
select
      i.store_id,
      s.store_name,
      round(sum(i.Stock_On_Hand*p.product_price), 2) as total_inventory_value
from
      inventory i
inner join
      stores s on i.store_id = s.store_id
inner join
      products p on i.product_id = p.product_id
group by
      i.store_id, s.store_name
order by
      total_inventory_value desc
limit 5
Bottom 5:
select
      i.store_id,
      s.store_name,
      round(sum(i.Stock_On_Hand*p.product_price), 2) as total_inventory_value
from
      inventory i
inner join
      stores s on i.store_id = s.store_id
inner join
      products p on i.product_id = p.product_id
group by
      i.store_id, s.store_name
order by
      total_inventory_value asc
limit 5
Q10) Is there any relationship between value of stock tied up and revenue by store?
Keeping a large amount of inventory is generally considered to be undesirable for a few different factors. For example, more inventory requires more storage, which increases costs. If customer tastes change, existing inventory is in danger of becoming obsolete.
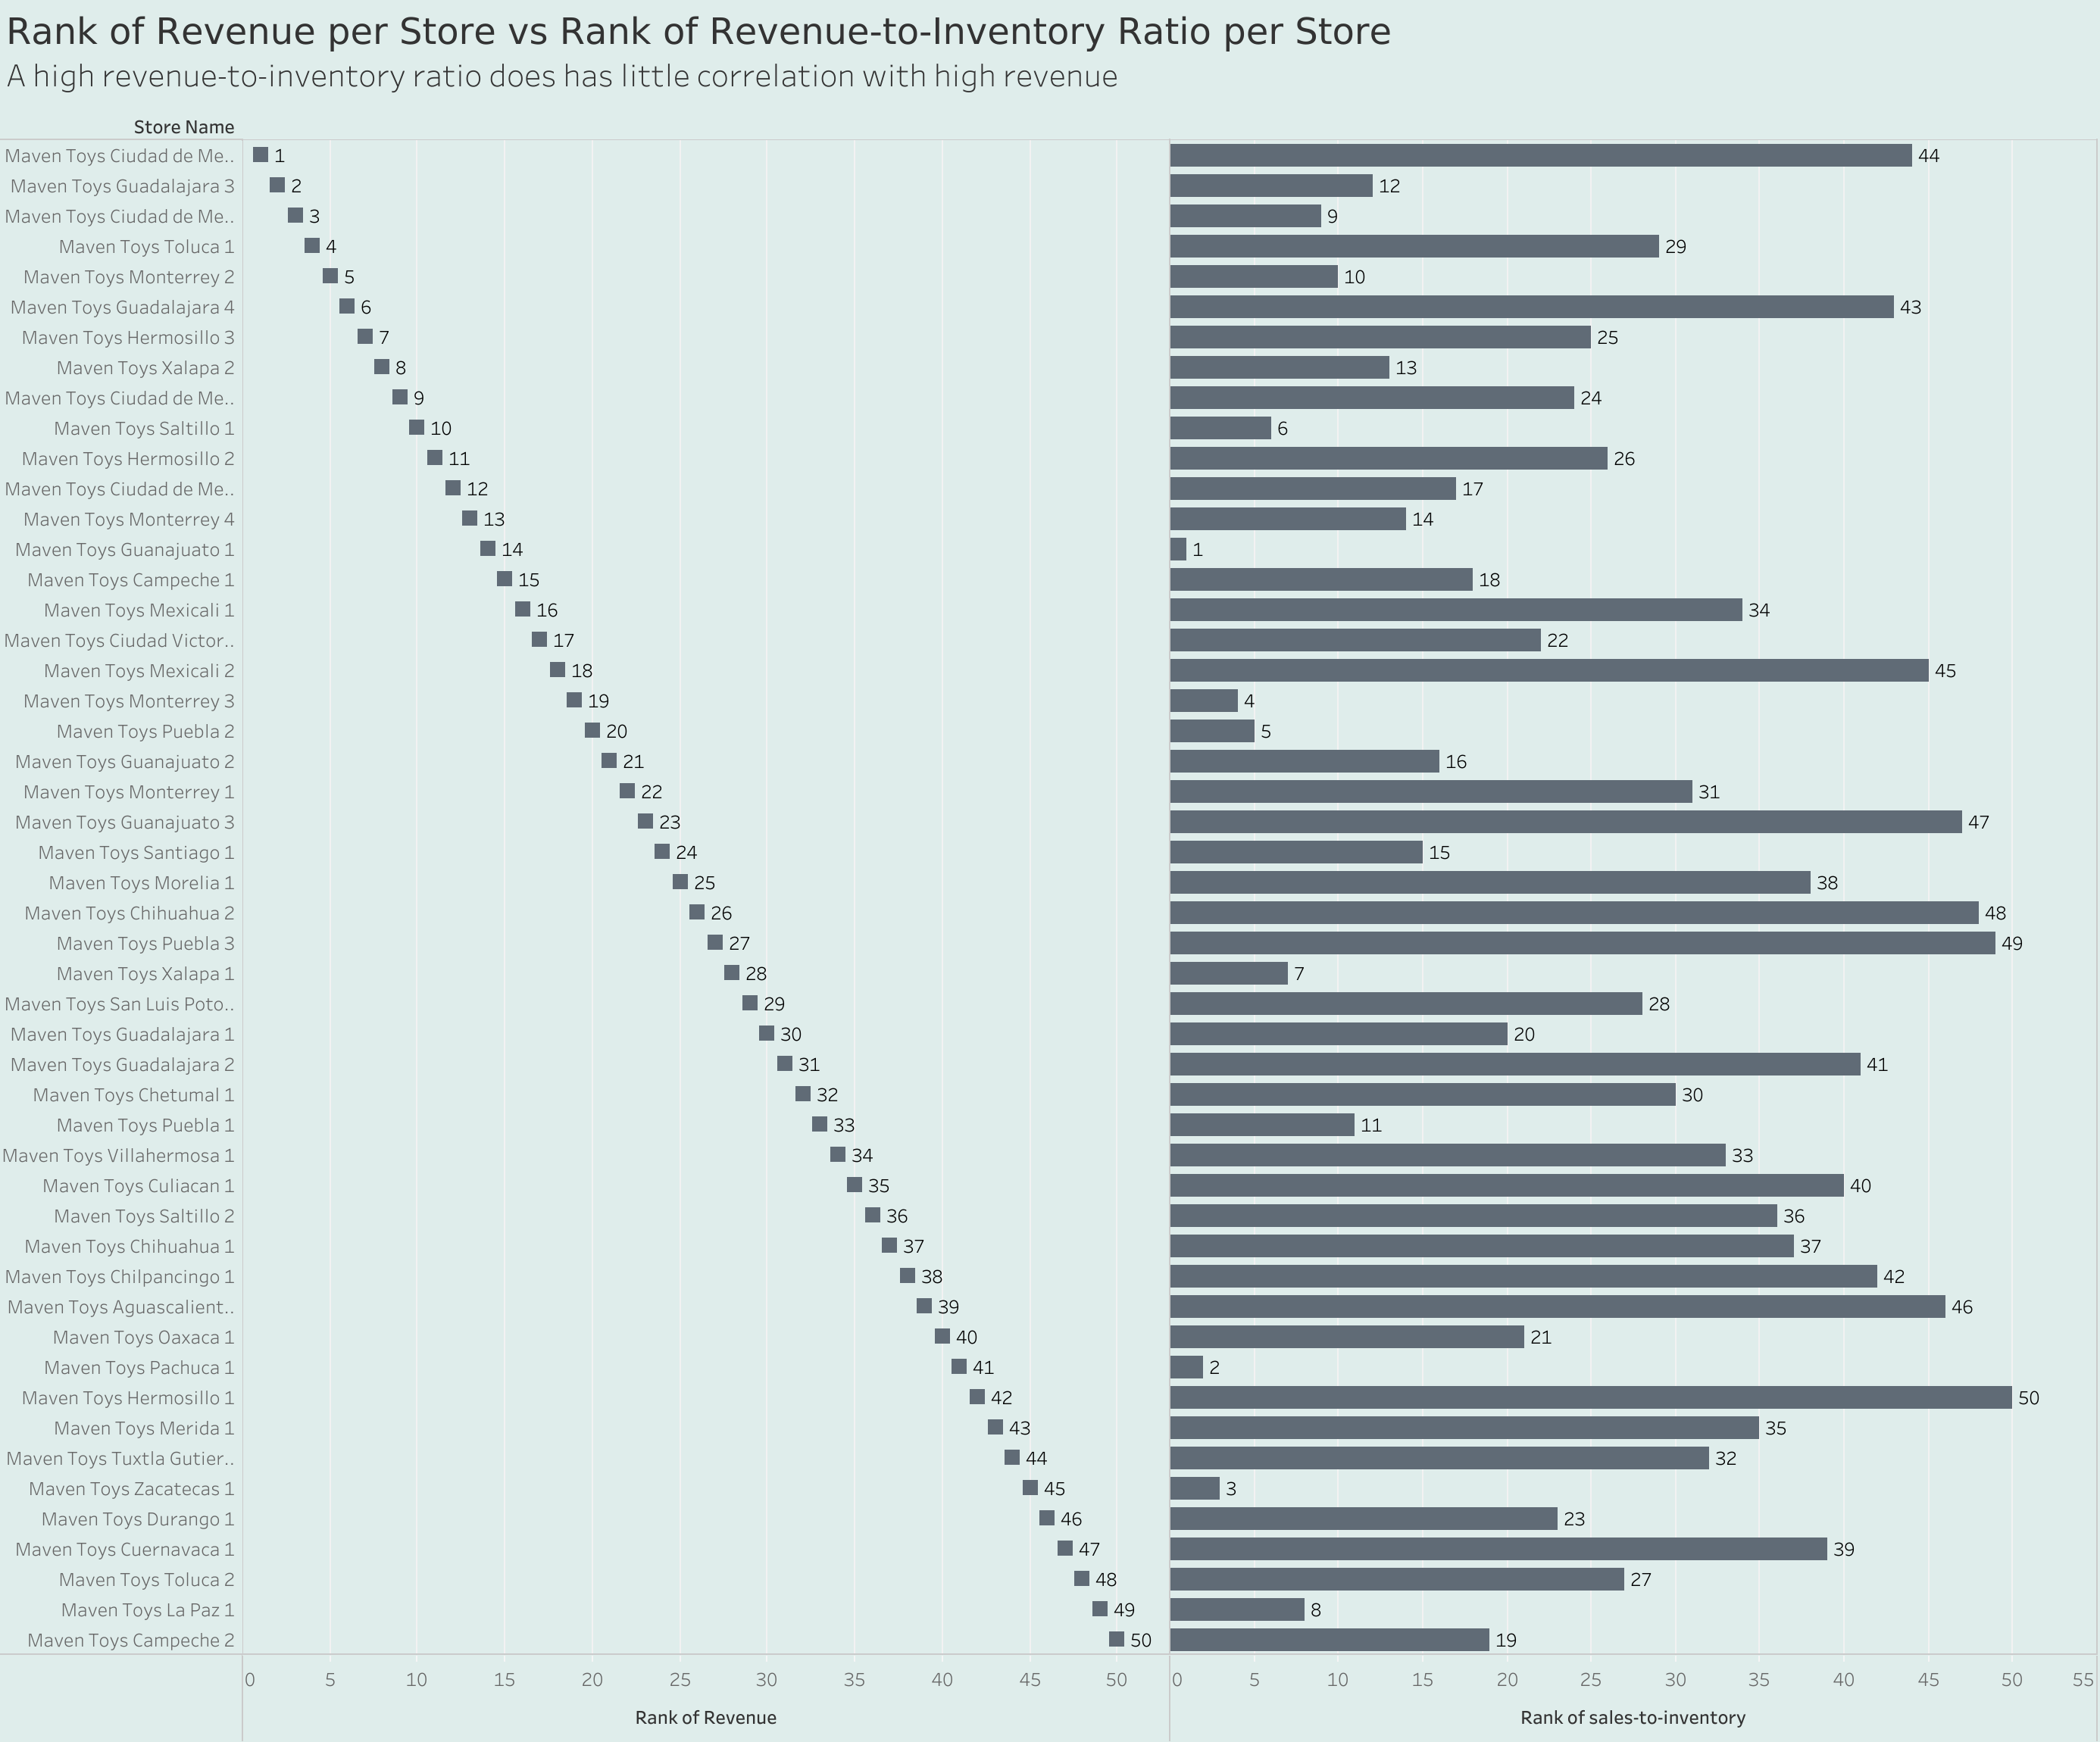
Keeping this in mind, I wanted to see if the value tied up in inventory has any relationship with store revenue. Financial theory tells us that a high revenue-to-inventory ratio suggests the company is selling its inventory quickly and efficiently, while a low ratio suggests that the company is struggling to sell its inventory.
Here I compare two ranked measures for each store. The first is the revenue-to-inventory ratio, where the 1st ranked store has the highest, and therefore ‘best’, revenue-to-inventory ratio. The second is revenue itself. Again, the store ranked 1st here has the highest revenue.
-- get inventory value per store

with inventory_value as(

      select
            i.store_id,
            s.store_name,
            round(sum(i.Stock_On_Hand*p.product_price), 2) as total_inventory_value
      from
            inventory i
      inner join
            stores s on i.store_id = s.store_id
      inner join
            products p on i.product_id = p.product_id
      group by
            i.store_id, s.store_name
      order by
            total_inventory_value),[2022-03-27-SQL-Coronavirus.md](2022-03-27-SQL-Coronavirus.md)

-- get total revenue per store

store_revenue as(

      select
            s.store_name,
            sum(p.product_price*t.units) as revenue
      from
            products p
      inner join
            sales_toys t on p.product_id = t.product_id
      inner join
            stores s on t.store_id = s.store_id
      group by
            s.store_name)

-- collect and return relevant results of above CTEs, joining on store_name

select
      inventory_value.store_name,
      inventory_value.total_inventory_value,
      store_revenue.revenue
from
      inventory_value
inner join
      store_revenue using(store_name)
order by
      store_revenue.revenue desc
Interpretation & Takeaway
Having a ‘good’ revenue-to-sales ratio does not imply that a store has high revenue. The store with the highest revenue, Maven Toys Ciudad de Mexico 2, is ranked 44 out of 50 when it comes to revenue-to-inventory ratio, a clear mismatch. The story is similar for the top 20 stores ranked by revenue. 14th-placed (by revenue) Maven Toys Guanajuato 1 is ranked the best (#1) for revenue-to-inventory ratio.
Therefore, this seems to suggest that just because a store has a large amount of inventory tied up, does not mean that its sales are suffering
